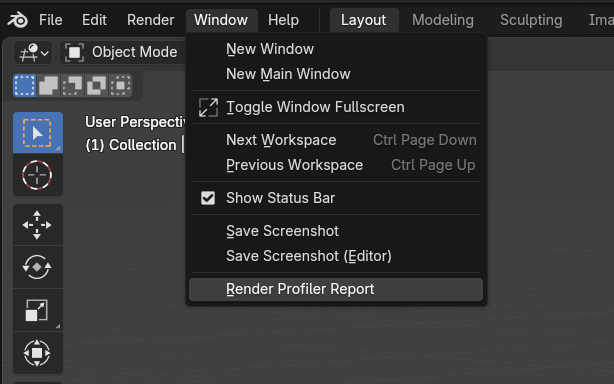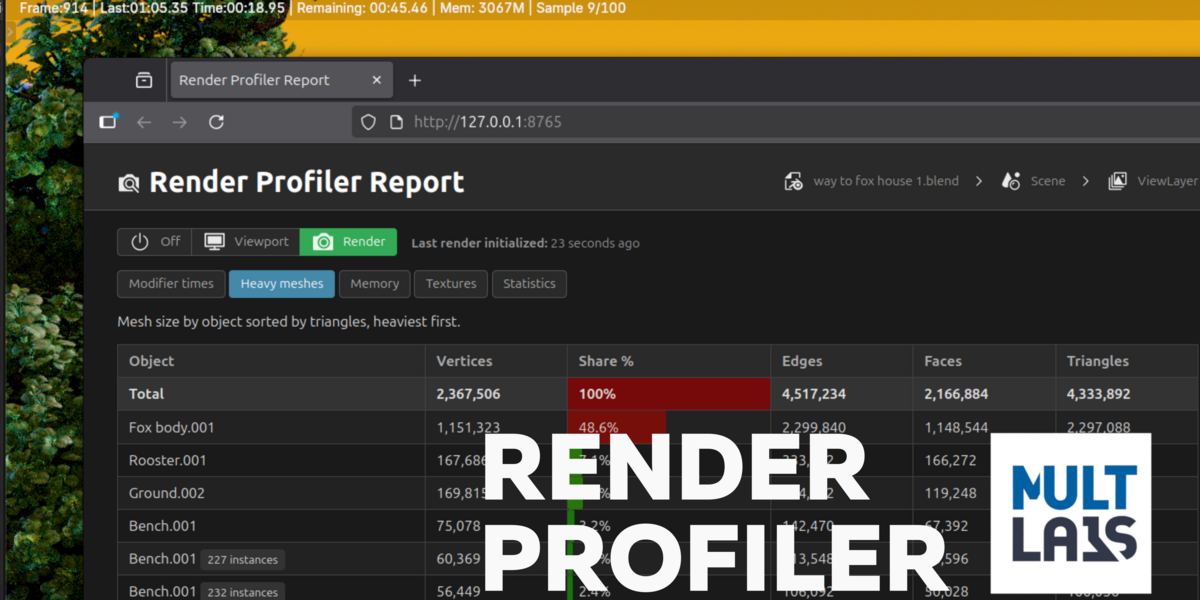

Render Profiler measures viewport and render performance and opens a live HTML report: modifier timings, meshes, textures, memory estimates, and statistics, kept in sync with Blender. Open it from Topbar → Window → Render Profiler Report, or from the File menu (F4).
The report shows which modifiers are slow, which meshes and images use memory, and how vertex counts differ between the viewport and the render. A free build is on Blender Extensions; the Superhive version is for anyone who wants to support the add-on.